DOCUMENTATION
Route Map
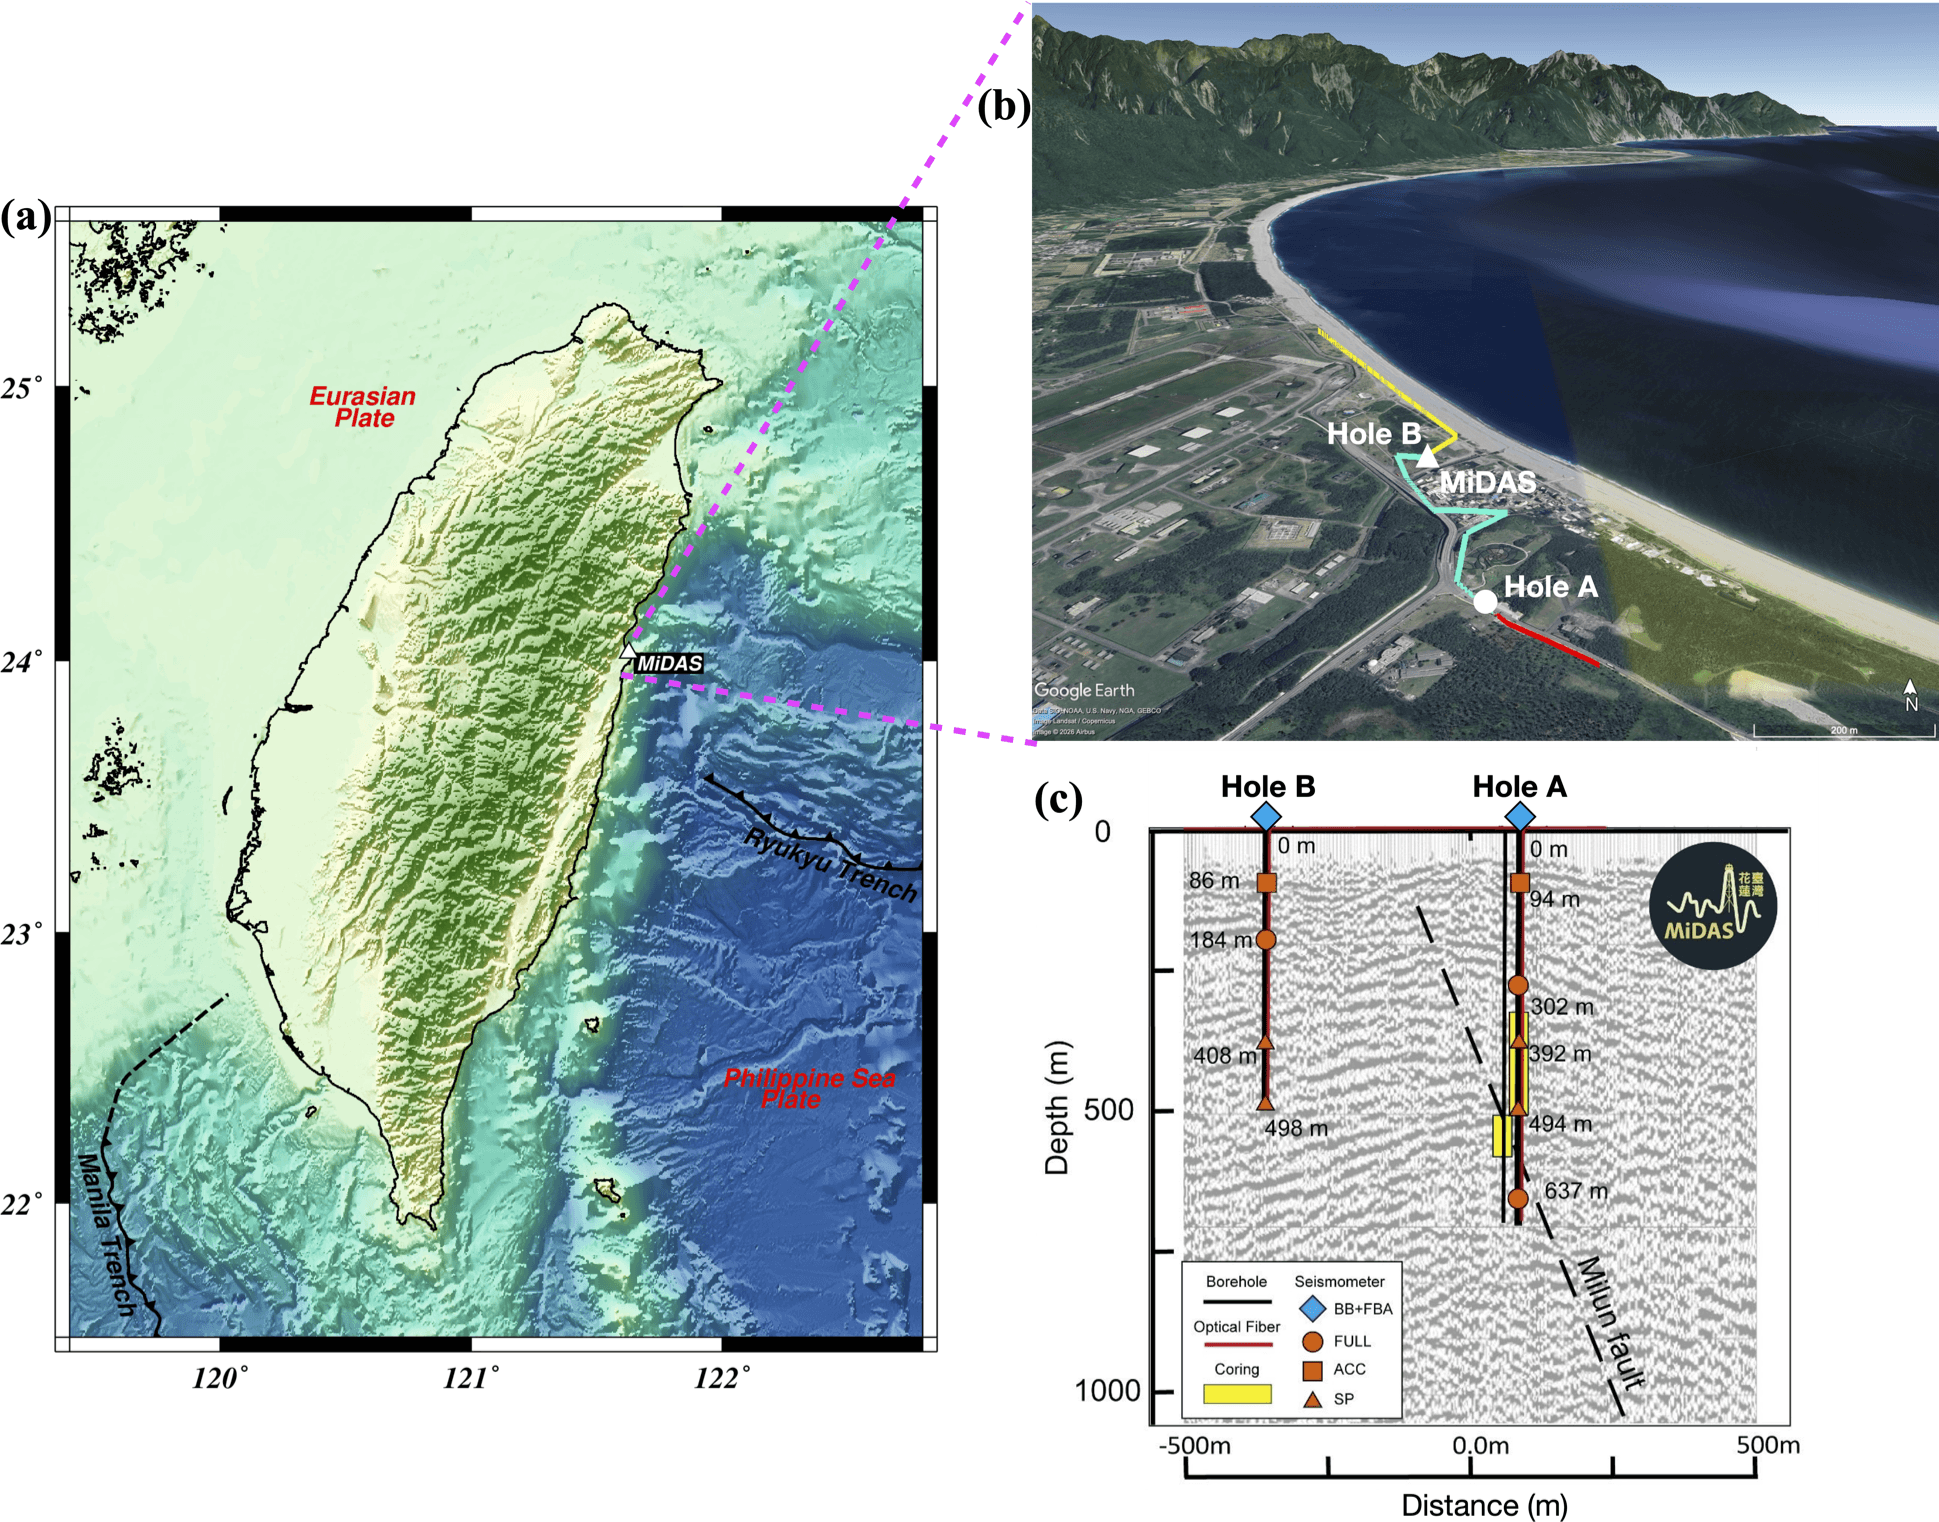
The MiDAS Observatory
(a) Location of the MiDAS observatory (white triangle) in Taiwan.
MiDAS 3D Array Configuration
(b) Schematic overview of the MiDAS 3D array configuration, showing the spatial relationship among the MiDAS station, surface fiber-optic cables, and boreholes. The MiDAS station (white triangle) is co-located with Hole B, while the white circle denotes Hole A. Surface fiber-optic cable segments are color-coded as Segment B (yellow), Segment CHT (cyan), and Segment A (red). The fiber-optic cable originates from the iDAS interrogator at the MiDAS station and extends toward the Qixingtan coastline along Segment B. At the northern coastal terminus, the fiber is fusion-spliced and routed back along the same path to Hole B, where it descends to the borehole bottom, is looped, and returns to the surface. The cable then continues along Segment CHT to Hole A, where it similarly descends, is looped at depth, and returns to the wellhead. From Hole A, the fiber transitions to Segment A, forming several surface paths with north-south, east-west, and southwest-northeast orientations. Although Segment A is shown in Figure 1b as extending along a roadside route, damage to the fiber in January 2024 limited the operational configuration to only these three short surface segments near Hole A. A detailed summary of the fiber-optic routing is provided in the metadata and supplementary material.
Downhole Fiber-Optic Installations
(c) Depth profiles of the downhole fiber-optic installations in Holes A and B and the associated borehole instrumentation. Multiple co-located sensors are installed at various depths within both boreholes: blue diamonds indicate combined broadband seismometers (BB) and force-balance accelerometers (FBA); orange circles represent full-band instruments that integrate downhole accelerometers (ACC) and short-period geophones (SP); orange squares denote locations with ACC only; and orange triangles mark positions with SP only. The dashed line indicates the Milun fault intersected by Hole A. All fibers (red lines) are connected as a single continuous cable to the iDAS interrogator. (Panel b is adapted from Google Earth Pro; panel c is modified from Ma et al., 2024.)
Waterfall Plot
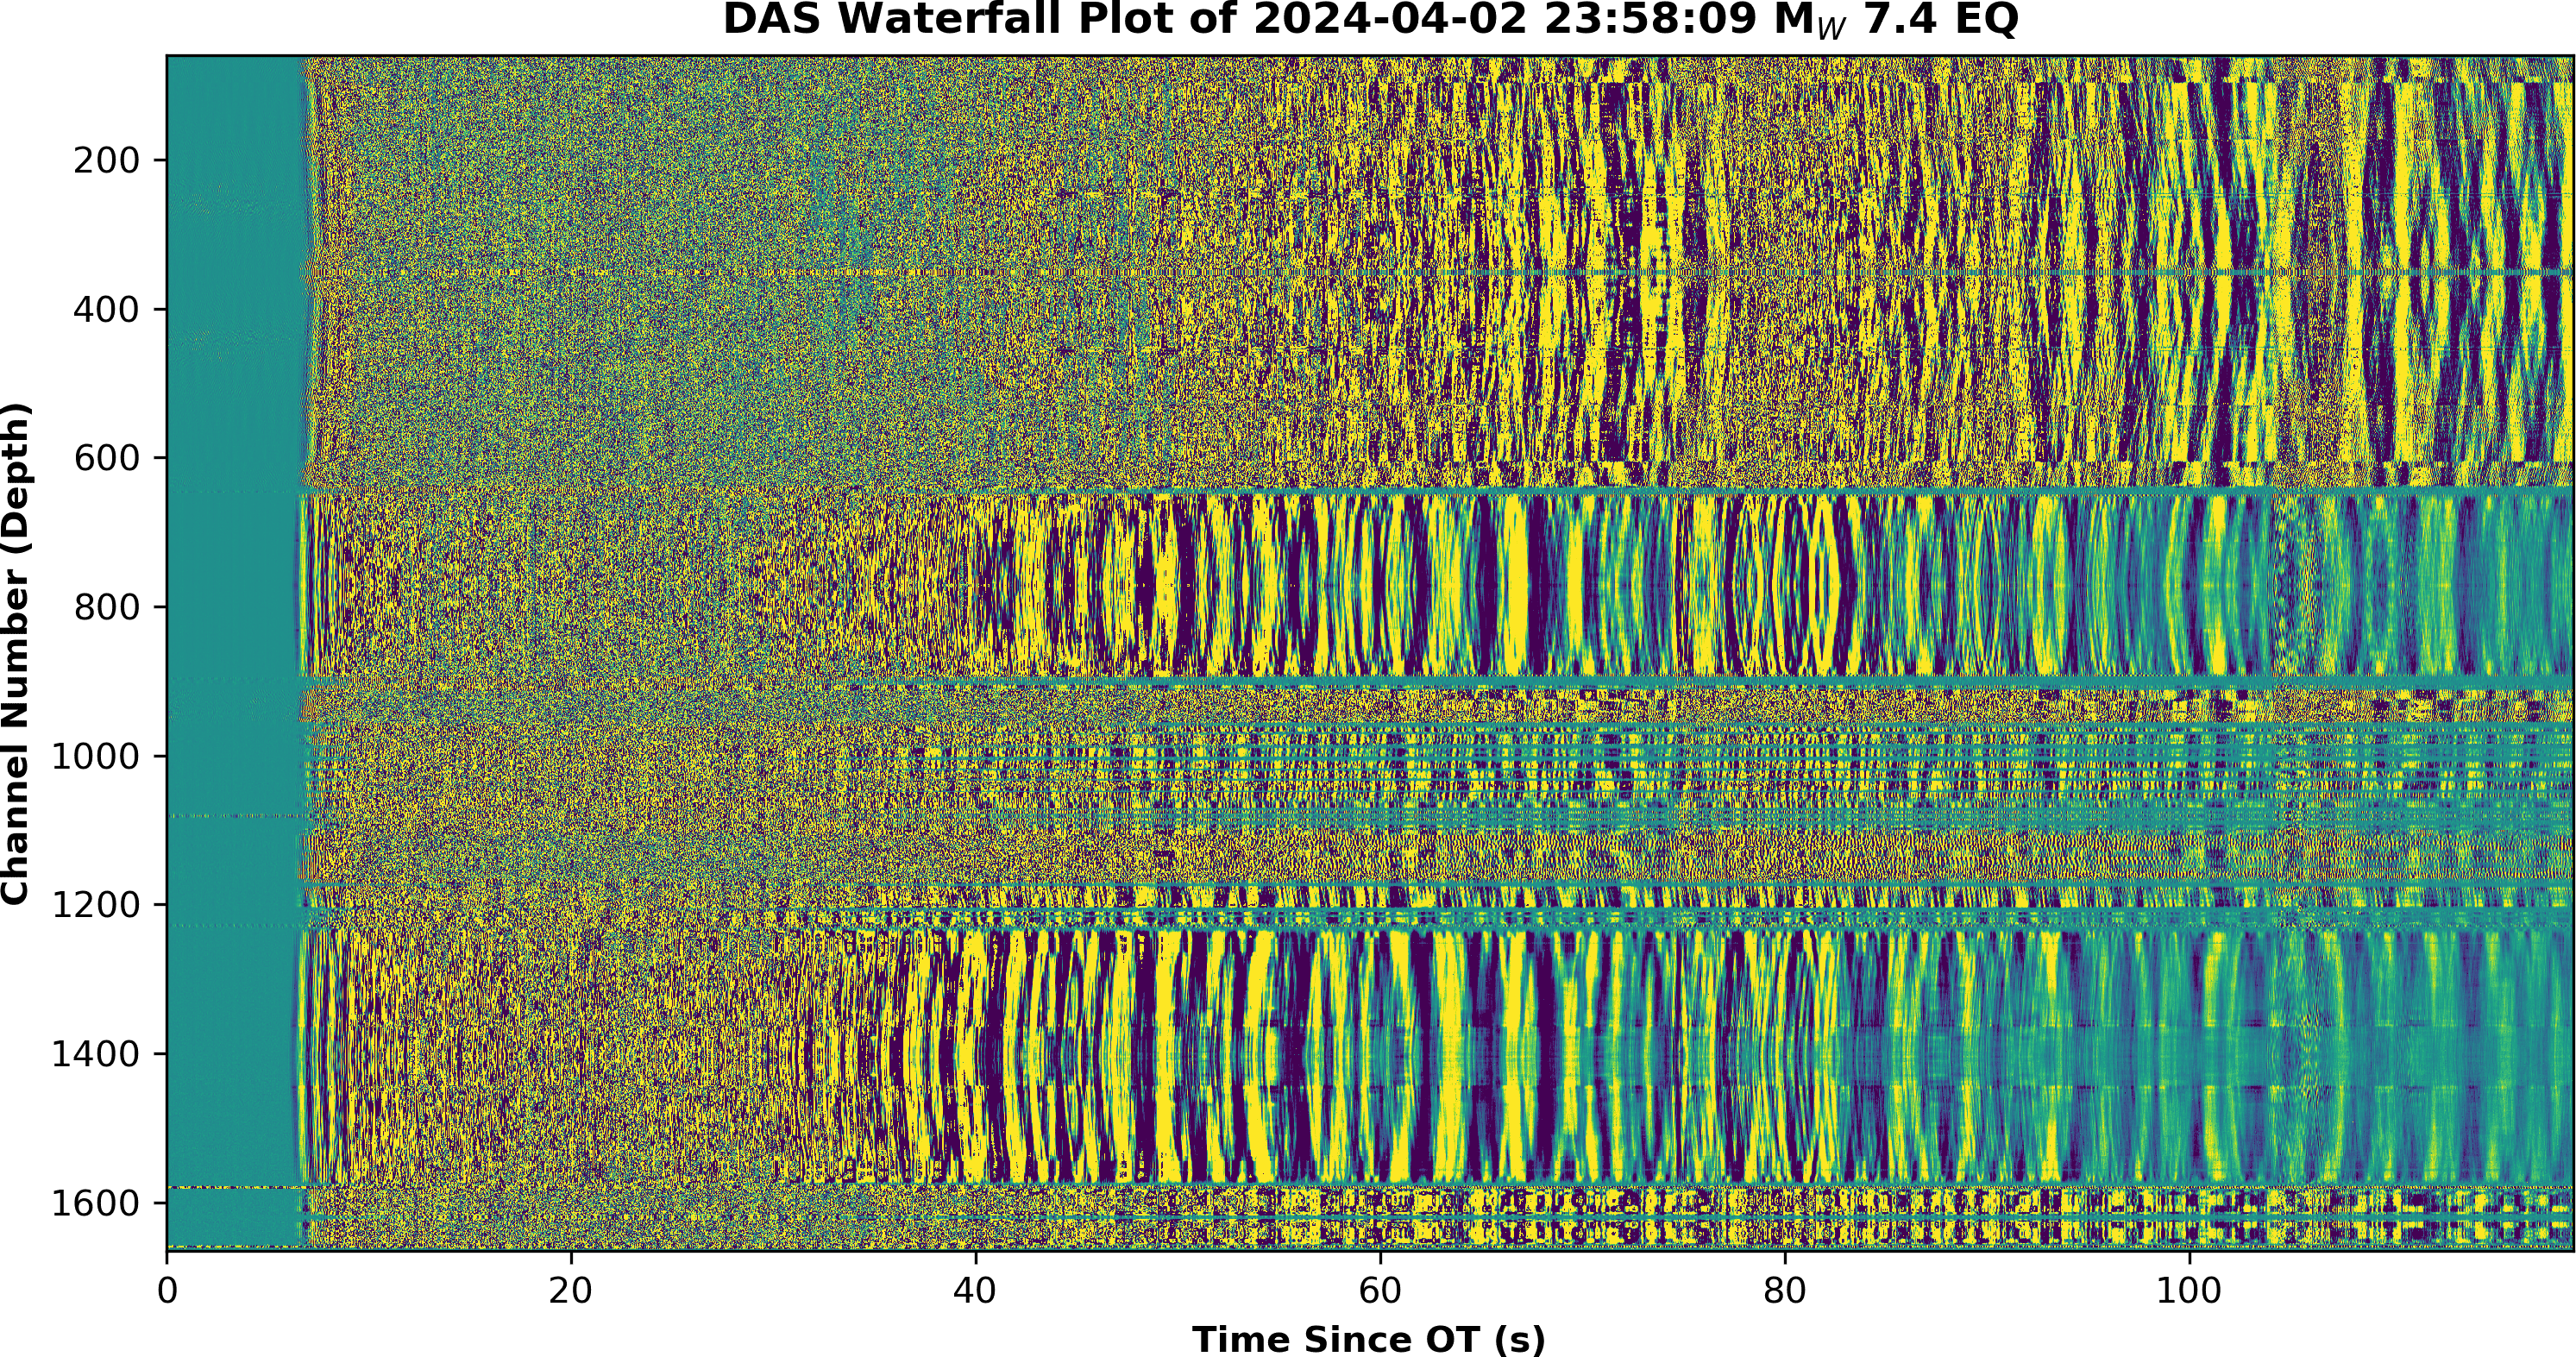
Waterfall view of the MiDAS DAS recording for the 2 April 2024 Mw 7.4 Hualien earthquake, illustrating the continuous strain-rate response observed across the full array.